3
ANNUAL REPORT 2015
financial highlights (cont’d)
0.00
5.00
10.00
15.00
20.00
25.00
2011
2012
2013
2014
2015
0
500
1,000
1,500
2,000
2,500
3,000
3,500
2011
2012
2013
2014
2015
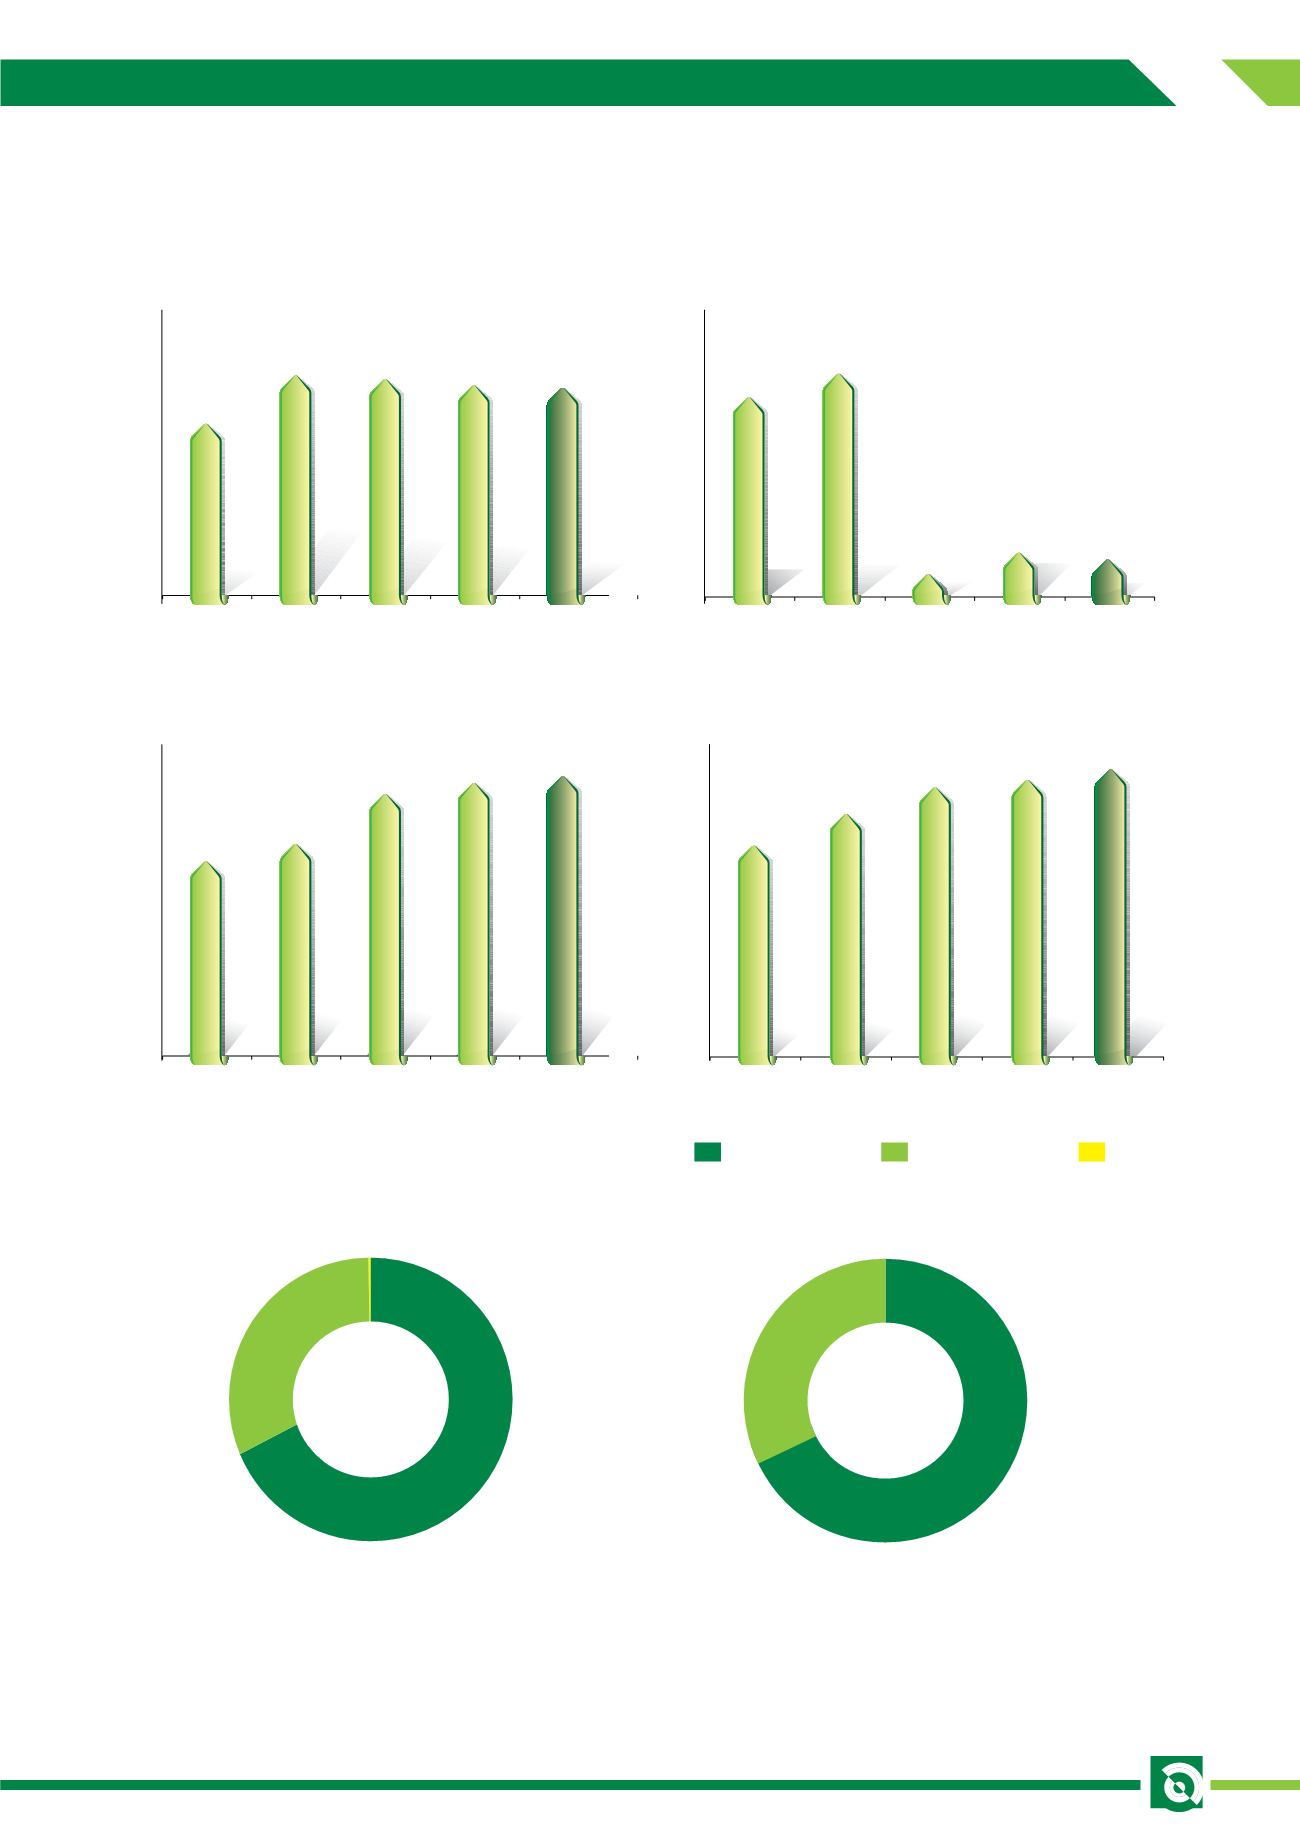
Earnings Per Share
(Sen)
Total Assets
(RM million)
-
200
400
600
800
1,000
1,200
1,400
2011
2012
2013
2014
2015
-
200
400
600
800
1,000
1,200
1,400
1,800
2,000
1,600
2011
2012
2013
2014
2015
Revenue
(RM million)
Equity Attributable to Equity Holders
(RM million)
71.1%
28.8%
0.1%
68.9%
31.1%
0.0%
Breakdown of Revenue by Segment
2015: RM1,032 million
2014: RM1,033 million
FY 2015
FY 2014
Timber Operations Oil Palm Operations Others
2,300
2,636
3,012
2,961
3,087
1,032
871
1,033
1,184
1,054
1,769
1,248
1,393
1,708
1,752
18.20
20.23
2.18
5.49
3.27


